
Polar Equations
by
Hieu Huy Nguyen
Our goal is to investigate the behavior of the polar equation r = a + b cos(kΘ). We want to know what happens to the graph for various values of k as a and b remains constant.
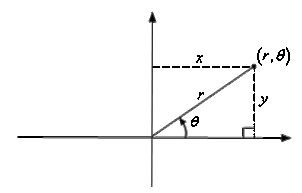
Polar coordinates are defined as points in the polar plane represented as (r,Θ). That point can also be visualized as a vector r from the origin with an angle measure of Θ rotating counter-clockwise from the positive x-axis. Polar coordinates are conversions of the Cartesian coordinates (x,y). r simply the Pythagorean theorem of the x and y distances. And Θ the tangent inverse of the x and y positions. The figure below illustrates the relation of Cartesian positioning with the polar coordinates.

We want to investigate what happens to our polar equation when a=b and k is varied; therefore, a = b = 1 are kept constant as we investigate the behavior of the graph as k changes.
For a = b= 1, k = 2 the following equation and graph are as illustrated below:


For a = b = 1, k = 4, the following equation and graph are illustrated below:
![]()

Based on the pattern that is observed, it is determined that the k represents the number of “loops” generated on the graph. We can observe the animation below to understand the behavior of the polar graphs as k vaires from -5 to 5.
We now want to investigate the behavior of the graph should we replace the cos( ) with sin( ).
For simplicity, we choose arbitrary values of a = 1, b = 1, and k =4. We then plot two graphs using cos( ) and sin( ) for each equation of r. The results of the graphs generated are illustrated below , respectively.
![]()

![]()

Based on the illustrations, we determine that changing the cos( ) to sin( ) in the polar equations would rotate the graphs couinter-clockwise by a shift of pi.
Go back to Hieu's HOME PAGE
Go back to EMAT 6680 HOME PAGE